
Energy Bills · Price Cap Forecast
Energy Price Cap January 2027: Forecast to Rise 16% to £1,999
The January to March 2027 price cap has not been set yet, but the latest forecasts put it between £1,999 and £2,085 a year for a typical home. Here is what is forecast, how much to trust it, and what it does to your bills.
Last updated: 7 October 2026
The energy price cap changes every three months, and the next change is on 1 January 2027. Ofgem will not confirm the figure until late November. Forecasters publish their estimates well before that, and the estimates for this winter have risen sharply in the past few weeks.
Quick answer: on 30 September, Cornwall Insight forecast a January to March 2027 price cap of £1,999 a year for a typical dual-fuel home paying by Direct Debit. That is £276, or 16%, above the current cap of £1,723. The average of the forecasts from EDF, British Gas and E.ON Next is higher, at £2,085, a rise of 21%. Gas is forecast to rise faster than electricity. These are forecasts, and Cornwall Insight's own figure moved by £127 in a single update. Ofgem will announce the real cap by 25 November 2026.
On this page:
What the forecasts say
Cornwall Insight is the forecaster most often quoted. It models the cap using Ofgem's published method. Its latest forecast was published on 30 September 2026, using market prices up to 28 September.
| Now: October to December 2026 | Forecast: January to March 2027 | Change | |
|---|---|---|---|
| Typical annual bill | £1,723 | £1,999 | +£276 (+16%) |
| Electricity, per kWh | 26.32p | 30.28p | +3.96p (+15%) |
| Gas, per kWh | 7.97p | 9.76p | +1.79p (+22%) |
| Electricity standing charge, per day | 54.83p | About 55p | Little change |
| Gas standing charge, per day | 29.68p | About 31p | About +1p |
The current column is Ofgem's confirmed cap. The forecast column is Cornwall Insight's. Both are for a home paying by Direct Debit, averaged across Great Britain. Your own rates vary by region and by how you pay.
Cornwall Insight is not the only forecaster, and it is currently the lowest of the ones we found:
| Forecaster | January to March 2027 | Rise on the current cap | Date |
|---|---|---|---|
| Cornwall Insight | £1,999 | +16% | 30 September |
| Average of EDF, British Gas and E.ON Next, as reported by MoneySavingExpert | £2,085 | +21% | Week of 28 September |
| EDF alone, as reported by IBTimes | £2,165 | +26% | 27 September |
What "typical" means now. Ofgem changed its definition of a typical home in July 2026, to 2,500 kWh of electricity and 9,500 kWh of gas a year. That is about 7% less electricity and 17% less gas than the old definition. Cap figures quoted before July 2026 are on the old basis and cannot be compared directly with these.
Why it is forecast to rise
The cause is the wholesale price of gas. Cornwall Insight says the rise is largely driven by the conflict in the Middle East, which is disrupting gas supplies to the UK and the rest of the world. It also points to gas storage in the EU, which was about 65% full in early September. That is the lowest level for the time of year in 15 years.
That is why the two fuels move differently. The gas unit rate is forecast to rise by about 22%, and electricity by about 15%. Electricity rises too because gas-fired power stations often set the wholesale electricity price in winter.
If the forecast is right, Cornwall Insight says it would be the largest single rise in the cap since January 2023.
How reliable is the forecast?
Treat it as a direction, not a number. Three things make the final figure uncertain.
Ofgem has said it will announce the January to March cap by 25 November 2026. We will update this page when a new forecast is published and again when the cap is confirmed.
What it means for your bill
The cap limits the price of each unit and the daily standing charge. It does not limit your total bill, so what you pay depends on what you use. Spread evenly over a year, the typical bill would go from about £144 a month to about £167 on Cornwall Insight's forecast, or about £174 on the suppliers' average.
To estimate your own rise, take your annual use from a recent bill. On Cornwall Insight's forecast rates, each kWh of electricity costs 3.96p more and each kWh of gas costs 1.79p more.
| Home | Electricity a year | Gas a year | Extra cost a year at the forecast rates |
|---|---|---|---|
| Electric-only flat | 2,000 kWh | None | About £82 |
| Typical home, as Ofgem defines it | 2,500 kWh | 9,500 kWh | About £276 |
| Larger gas-heated house | 3,500 kWh | 15,000 kWh | About £410 |
These are annual figures, worked out as if January's forecast rates lasted a full year. The cap is reset again in April. January to March is also when most homes use the most gas, so the rise will show up more in winter bills than an even monthly split suggests.
What appliances would cost to run at 30.28p
Every running cost on this site is worked out at the current electricity rate of 26.32p per kWh. Here is what the same appliances would cost at Cornwall Insight's forecast rate of 30.28p.
| Appliance | Electricity used | Now, at 26.32p | January forecast, at 30.28p |
|---|---|---|---|
| 2kW fan heater | 2 kWh an hour | 53p an hour | 61p an hour |
| Heated clothes airer, 300W | 0.3 kWh an hour | About 8p an hour | About 9p an hour |
| Heated airer, small load | About 1.4 kWh | About 37p | About 42p |
| Vented or condenser tumble dryer, one load | About 2.5 kWh | About 66p | About 76p |
| Heat pump tumble dryer, one load | 1 to 1.5 kWh | 26p to 39p | 30p to 45p |
| Dehumidifier, 151W to 355W | 0.15 to 0.36 kWh an hour | 4p to 9p an hour | 5p to 11p an hour |
| Dehumidifier, 8 hours a day for a month | 36 to 85 kWh | £10 to £22 | £11 to £26 |
The order does not change: a cheap appliance stays cheap and an expensive one stays expensive. What changes is the size of the gap. Drying a load on a heated airer instead of in a condenser tumble dryer saves about 29p now and about 33p at the forecast rate. Our guide to dehumidifiers against tumble dryers has the full comparison.
Gas is rising faster than electricity: what that changes
Because gas is forecast to rise by more than electricity, the gap between the two narrows. Electricity costs 3.3 times as much as gas per kWh today. On the January forecast it would cost 3.1 times as much.
That matters for heat pumps, which use electricity to do a job a boiler does with gas. Assume a gas boiler that turns 85% of its gas into heat. At today's rates, a heat pump has to deliver about 2.8 units of heat for each unit of electricity to match that boiler's cost per unit of heat. At the forecast January rates the figure falls to about 2.6. This compares unit rates only and leaves out standing charges and installation costs. Our heat pump running costs for 2027 guide goes through it in detail.
The same change makes home-generated electricity worth more. Each kWh of solar power you use yourself would save 30.28p instead of 26.32p. If you are weighing up solar panels, a home battery or a plug-in solar kit, rerun the payback at the higher rate, but remember the cap is reset every three months.
What you can do before January
Key dates
| Date | What happens |
|---|---|
| 28 October 2026 | Autumn Budget. Any change to energy bill support would be announced here. |
| Mid-November 2026 | The wholesale pricing window for the January cap closes. |
| By 25 November 2026 | Ofgem announces the January to March 2027 price cap. |
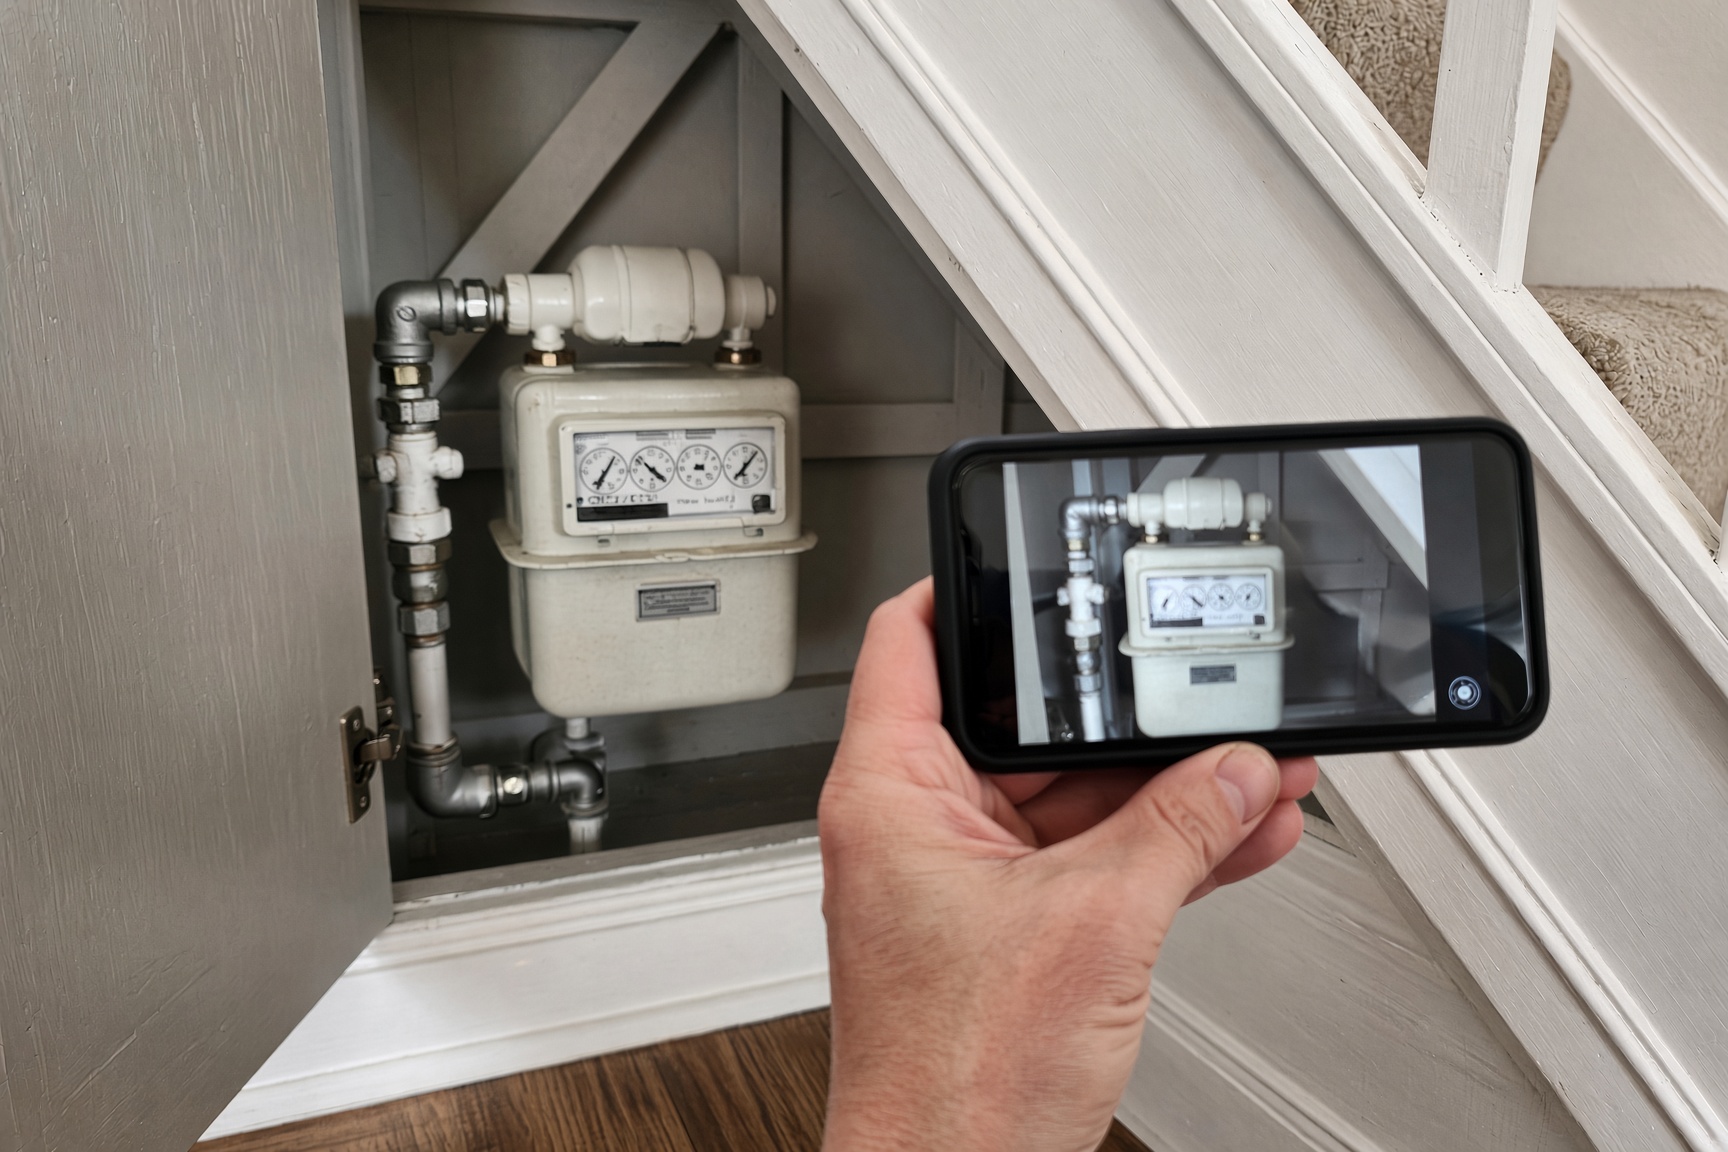
| 31 December 2026 | ECO4 closes. Take meter readings if you do not have a smart meter. |
| 1 January 2027 | The new cap takes effect. |
| 31 March 2027 | The 0% VAT rate on domestic electricity is due to end. |
| 1 April 2027 | The cap is reset again for April to June. |
Frequently asked questions
Cut the bill before the rise arrives
Start with the changes that cost little or nothing, in order of what they save.
See the Energy Efficiency Bundle →Related Guides
Published 7 October 2026. Current cap rates are from Ofgem's price cap notice for 1 October to 31 December 2026. The January forecast is from Cornwall Insight's release of 30 September 2026. Supplier forecasts and fixed tariff figures are as reported by MoneySavingExpert on 2 October 2026, and EDF's forecast as reported by IBTimes on 27 September 2026. Appliance costs are the energy used multiplied by the unit rate. Heat pump figures assume an 85% efficient gas boiler and compare unit rates only. This page is information, not financial advice.